Dividend Gems Has Destroyed the S&P 500 Performance Since the Beginning of 2022

We normally don't compare the performance of the securities on the Dividend Gems Recommended List versus the S&P 500 Index because Dividend Gems is actively managed, and contains many options for investors based on different scenarios. Thus, such a comparison would be very time consuming even for a one-month comparison and virtually impossible to determine over longer durations.
But just to give you an idea how good the Dividend Gems Recommended List of securities is, we wondered how a passive holding strategy had performed year-to-date (YTD) verus the S&P 500 Index, so we checked it out.
We chose a YTD duration since the S&P 500 made record highs at the beginning of the year (January 3, 2022) and has declined since then.
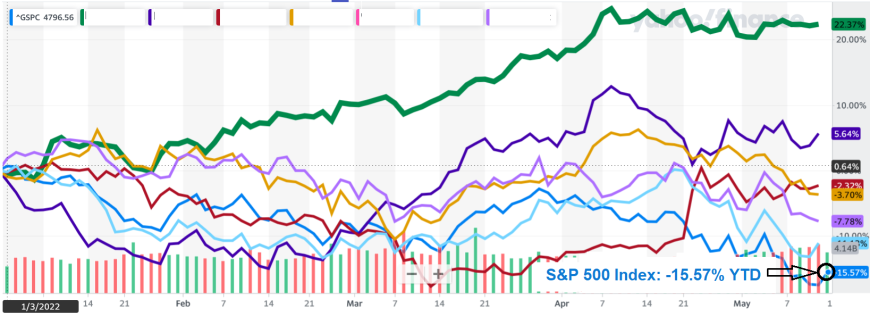
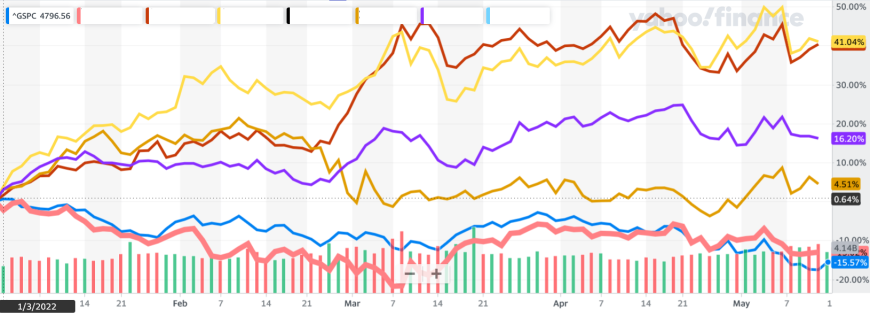
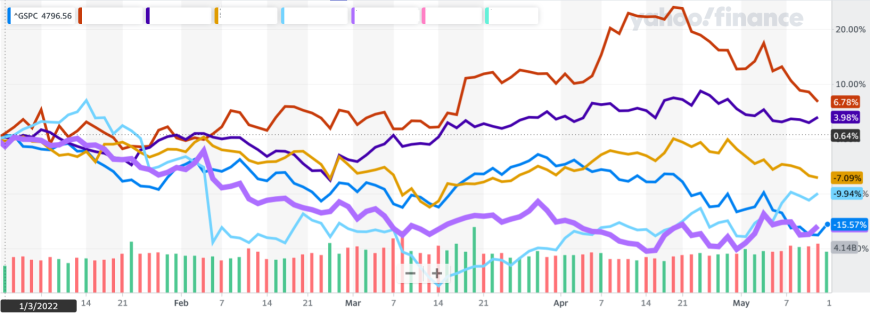
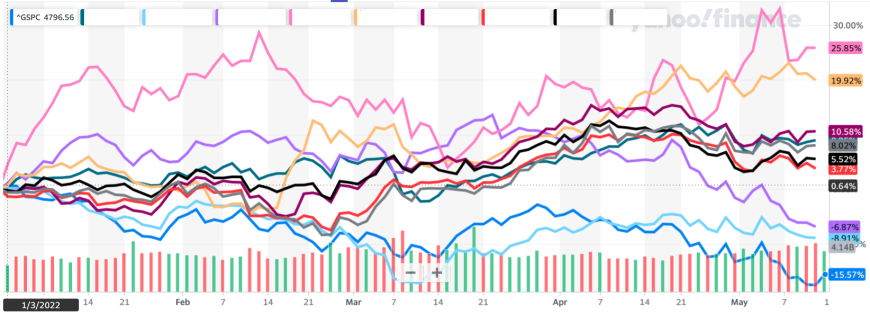
As the following charts reveal, passively holding the Dividend Gems Recommended List significantly outperformed the S&P 500.
As the following charts reveal, most of the stocks on the list have positive returns for the year, not counting dividends.
In order to emphasize how stunning this performance is, you need to understand that each monthly Dividend Gems research report contains active management recommendations for each security based on a variety of factors in order to help investors minimize downside and optimize upside.
In other words, the returns obtained from active management of the Recommended List far exceed a passive, or buy-and-hold strategy.
Our track record of active management guidance is quite impressive and has multiplied the returns of the securities in Dividend Gems.
>>> MORE INFORMATION ABOUT DIVIDEND GEMS <<<
If we included the active management of the securities from the DG Recommended List, the performance would be much, much higher. But there is no way to show these total returns on a chart. In addition, the active management guidance is not always cut and dry, so exact performance results are extremely difficult to determine and are subjective.
Note: We did not include securities from DG that we have been advising investors to avoid because we felt they would decline for some time.
As you inspect the charts, note that the S&P 500 Index is shown by the aqua colored line and is down by 15.57% since the beginning of the year through May 13, 2022.
Remember that the performance below is from a passive strategy. If the results of our active management recommendations were included, the performance would be signifcantly greater.
Do you want to outperform the S&P 500?
Subscribe to Dividend Gems today.
>>> MORE INFORMATION ABOUT DIVIDEND GEMS <<<